In last post, we created a setup with Prometheus, Node Exporter and Grafana. In this post, we would proceed to create Dashboards, which is the real beauty of the setup.
With Monitoring Dashboards, I would recommend having two step Dashboard system means one summary dashboard which covers all the nodes at once and then different node names hyper-linked with a detailed dashboard specific to that node. In different scenarios, rather than node, it might be process or application or anything else whose performance you want to see in details but here we would focus on Linux or Windows Node overall metrics for simplicity.
Let’s talk about creating a Linux summary dashboard like below one. It’s for just one node but it would keep on scaling as more nodes added in Prometheus target config.
Step 1 would be reset the admin password for Grafana. Default username/password would be admin/admin.
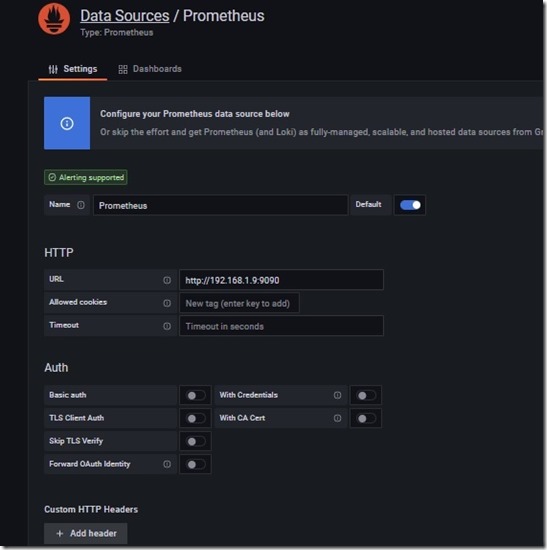
Once that is out of way, next step would be to create a data source. You would need to got to cog wheel and chose data sources or just go to http://[Prometheus-server-ip]:3000/datasources and then add data source from there
As you can see, there are a number of options, but simplest one would need just a name then url as http://[prometheus-server-ip]:9090 and it would be enough to get things started. For security, you might need to go for advanced options but here we would keep things simple.
You can create two folders: Windows Nodes and Linux Nodes for management purposes, then we can proceed to create two dashboards each in both folders like above.
Let’s talk of Linux Dashboard
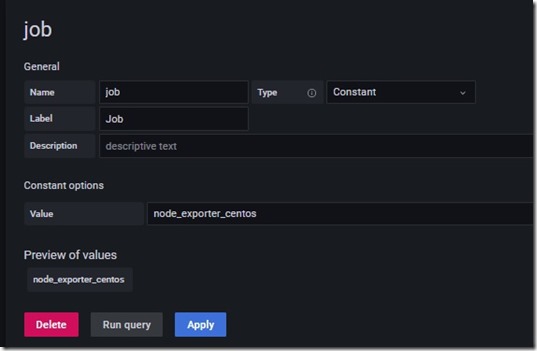
There might be different ways to get things going but to start simple go to settings via cog wheel and then go to variables then create a new variable named job.
You can define value of constant exactly as your job name for Linux targets in prometheus.yml.
Now in dashboard as a row named Overview and then proceed to add panels. I would list down all the queries in order.
count(up{job="$job"})-sum(up{job="$job"}) # Number of offline nodes
sum(up{job="$job"}) # Number of online nodes
up{job="$job"} # Up/down status, where you need to define value mapping as 1 for Up and 0 for Down.
node_boot_time_seconds{}*1000 # last boot time, the value would need to be transformed in time type
(last_over_time(node_uname_info{job="$job"}[$__rate_interval]) == 1) * on(job, instance) group_left(pretty_name) node_os_info{} * on(job, instance) group_left(time_zone) node_time_zone_offset_seconds{} # System Info
node_filesystem_free_bytes{fstype!~"tmpfs|rootfs"}/1073741824(node_filesystem_size_bytes{fstype!~"tmpfs|rootfs"}/1073741824)*0.20 # Disk space below 20%
(node_memory_MemFree_bytes{}/node_memory_MemTotal_bytes)*100 # Memory utilization %
max by (instance, mountpoint) (node_filesystem_free_bytes{fstype!~"tmpfs|rootfs"}/1073741824) # Query 1 for Disk graph in same panel
max by (instance, mountpoint) (node_filesystem_size_bytes{fstype!~"tmpfs|rootfs"}/1073741824) # Query 2 for Disk graph in same panel
(node_memory_MemFree_bytes{}/node_memory_MemTotal_bytes)*100 < 15 # Nodes with less than 15% memory left
One more thing, to add hyper-link for individual nodes in tables, you need to add data links in individual panels with below code
http://[grafana-server-ip]:3000/d/[9digitcode_for_detailed_dashabord]/linux-metrices-detailed-base?orgId=1&var-host=${__data.fields.instance}&var-job=${__data.fields.job
You would need to copy the url from the second dashboard created in the same folder (Linux nodes) till orgId=1 to make sure that you get it right. We doing this so that when someone clicks on any individual row related to particular then it would pick the job variable value and instance value and then open the page specific to that node only. How? We would cover the same next in detailed dashboard.
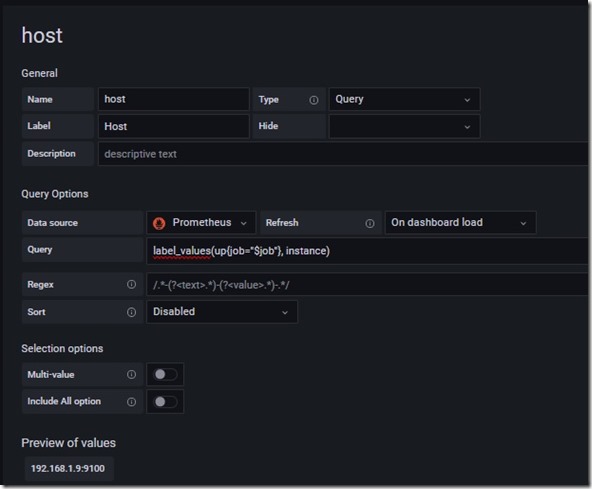
Go to settings of new dashboard and define two variables, first job, exactly like we did in last dashboard and then another one named host (can chose instance as well but you would need to replace $host from queries which I would give next).
The query in above is the below one
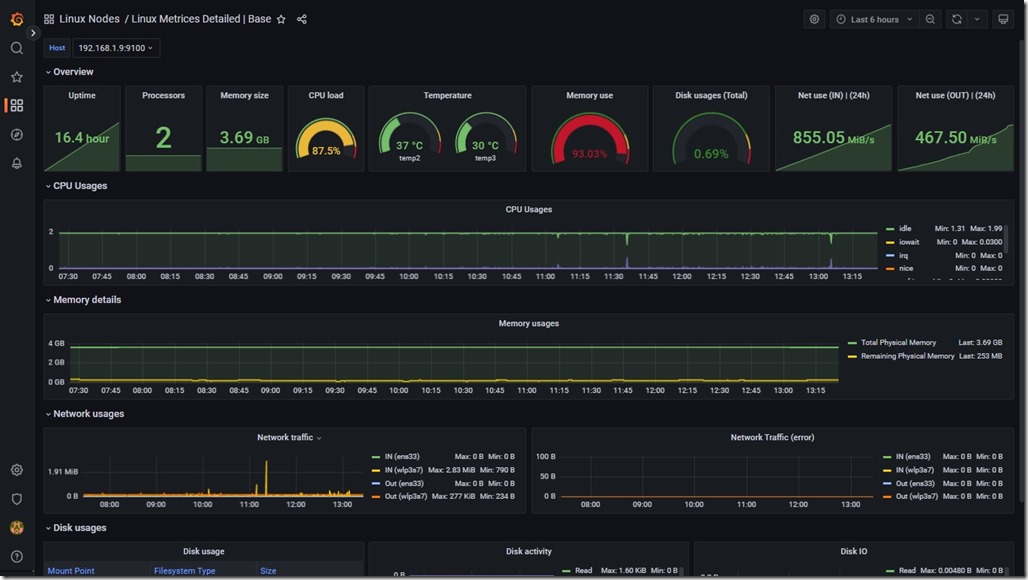
label_values(up{job="$job"}, instance)Once the two variables are set, I would list down the queries for creating a dashboard like below one
Now here goes the queries in order
node_time_seconds{instance='$host'} - node_boot_time_seconds{instance='$host'} # uptime
count(node_cpu_frequency_max_hertz{instance="$host"}) # CPU count
node_memory_MemTotal_bytes{instance="$host"}/1073741824 # Physical Memory
100-(avg(irate(node_cpu_seconds_total{instance="$host"}[2m])))*100 # CPU utilization
node_hwmon_temp_celsius{instance="$host"} # Temperature
100 - (node_memory_MemFree_bytes{instance="$host"}/node_memory_MemTotal_bytes{instance="$host"})*100 # Memory utilization
100 - (sum(node_filesystem_free_bytes{instance="$host"})/sum(node_filesystem_size_bytes{instance="$host"}))*100 # Disk utilization
sum(increase(node_network_receive_bytes_total{instance="$host"}[24h])) # Data received in last 24 hrs
sum(increase(node_network_transmit_bytes_total{instance="$host"}[24h])) # Data sent in last 24 hrs
(last_over_time(node_uname_info{job="$job", instance="$host"}[$__rate_interval]) == 1) * on(job, instance) group_left(pretty_name) node_os_info{} * on(job, instance) group_left(time_zone) node_time_zone_offset_seconds{} # System information
sum by (mode)(irate(node_cpu_seconds_total{instance="$host"}[5m])) # CPU usages graph
node_memory_MemTotal_bytes{instance="$host"}/1073741824 # Memory usages query 1
node_memory_MemFree_bytes{instance="$host"}/1073741824 # Memory usages query 2
irate(node_network_transmit_bytes_total{instance="$host", device=~'ens.*|wlp.*'}[5m])*8 # Network usages query 1 | ens and wlp are NIC names in my system, your systems might have ens, eth or something different
irate(node_network_receive_bytes_total{job="$job",instance="$host", device=~'ens.*|wlp.*'}[5m])*8 # Network usages query 2
max by (instance, mountpoint, fstype, value) (node_filesystem_free_bytes{instance="$host",fstype!~'tmpfs|rootfs'}) # Disk usages
irate(node_disk_read_bytes_total{instance="$host",fstype!~"tmpfs|rootfs"}[5m]) # Disk activity query 1
- irate(node_disk_written_bytes_total{instance="$host",fstype!~"tmpfs|rootfs"}[5m]) # Disk activity query 2
sum(node_systemd_unit_state{instance="$host"})by (state) # Service status graph
last_over_time(node_systemd_unit_state{}[$__rate_interval])==1 # Service status table
This is in no way complete steps as you need to setup a few things about each type of panel, their placement, thresholds, value mapping, field organization, renaming etc as well but I would intentionally leave those over you for two reasons; mine is just primitive and there is a lot more available in dashboard gallery from Grafana and second reason, I trust you would be able to come up with even better-looking dashboards suitable for your environment.
What about Windows Nodes??? Well! We can create dashboard in the same manner for the same as well. May be would list the queries in next post.
Let me know your feedback that how it’s going so far.


One thought on “Monitoring IT Infra with Prometheus and Grafana – Part 2”