One stop Bash script to setup Prometheus, Grafana and Windows Exporter on CentOS Linux Machine

In the last post, we covered about the PowerShell script to install Prometheus, Grafana and Windows Exporter on a Windows Server, which was more of a fun project considering most organizations or people would prefer to have these installed over Linux servers (At least Prometheus and Grafana for sure) and not sure anyone would prefer the same in production considering cost, performance and other reasons. Windows nodes anyways can send data to such Linux Servers.

I do not have background in shell scripting so earlier, I did post step by step guide about how to setup the same over a Linux server but post the PowerShell script, I thought why not to replicate the same with a single Bash script as it would be lot fun to learn the language in the process. So here we go with the first version of script.

The script is not exactly similar to the windows one and as of now do not have removal and configuration related functions. Also I would need to see how it can work over remote nodes for scaling purposes but AS IS it does download the latest versions of the packages and then installs those.

Nitish Kumar
Continue reading “One stop Bash script to setup Prometheus, Grafana and Windows Exporter on CentOS Linux Machine”

One stop PowerShell script to setup Prometheus, Grafana and Windows Exporter on Windows Machine

After setting up Prometheus, Grafana over Linux host, I was approached for similar setup over Windows. That had separate set of challenges since Prometheus and Grafana projects, despite of requests in last couple of years, are not yet compatible with Microsoft Service Framework. Even official documentation proposes solution via nssm, which is another OSS project (in a way).

Though I would have created similar step by step doc for Windows, thought to do better this time and almost half day work brought us a PowerShell script, which can download almost all the latest packages (except nssm, which is not github hosted) and then proceed to configure them on the same machine. Functions to download and create services are created in a way that select set of package can be downloaded or installed as putting everything on the same server may not be good idea.

This is still not ready for production use as there might be random quirks but here we do with the complete script, which has an experiment Prometheus configuration function as well.

Continue reading “One stop PowerShell script to setup Prometheus, Grafana and Windows Exporter on Windows Machine”

Monitoring IT Infra with Prometheus and Grafana – Part 3

In last post, we created Dashboards for Linux nodes monitoring. Please note, Linux and Windows are not only things which can be monitored but would leave that part to figure you out in case if you have any use case.

Let’s talk about creating a Windows summary dashboard this time like below one. It’s for just one node but it would keep on scaling as more nodes added in Prometheus target config.

Continue reading “Monitoring IT Infra with Prometheus and Grafana – Part 3”

Monitoring IT Infra with Prometheus and Grafana – Part 2

In last post, we created a setup with Prometheus, Node Exporter and Grafana. In this post, we would proceed to create Dashboards, which is the real beauty of the setup.

With Monitoring Dashboards, I would recommend having two step Dashboard system means one summary dashboard which covers all the nodes at once and then different node names hyper-linked with a detailed dashboard specific to that node. In different scenarios, rather than node, it might be process or application or anything else whose performance you want to see in details but here we would focus on Linux or Windows Node overall metrics for simplicity.

Let’s talk about creating a Linux summary dashboard like below one. It’s for just one node but it would keep on scaling as more nodes added in Prometheus target config.

Continue reading “Monitoring IT Infra with Prometheus and Grafana – Part 2”

Monitoring IT Infra with Prometheus and Grafana – Part 1

Recently in pursuit of Open Source solution to monitor a stack of Jenkins and Team City nodes, I got chance to explore Prometheus and Grafana, which brought back all the fun, I used to have with CentOS and Open Source. That prompted me to write a step-by-step guide about setting up one.

Roughly 12 years back, I wrote a blog about Zabbix Monitoring when I was managing couple of data centres of a BPO in Delhi. In those days, I worked over a number of solutions over CentOS but later on in career,  I got more engaged in Windows side of world. Microsoft Azure, O365 and more so Windows PowerShell and lost touch with such Open Source solutions for monitoring. But what better to resume the touch than Prometheus and Grafana.
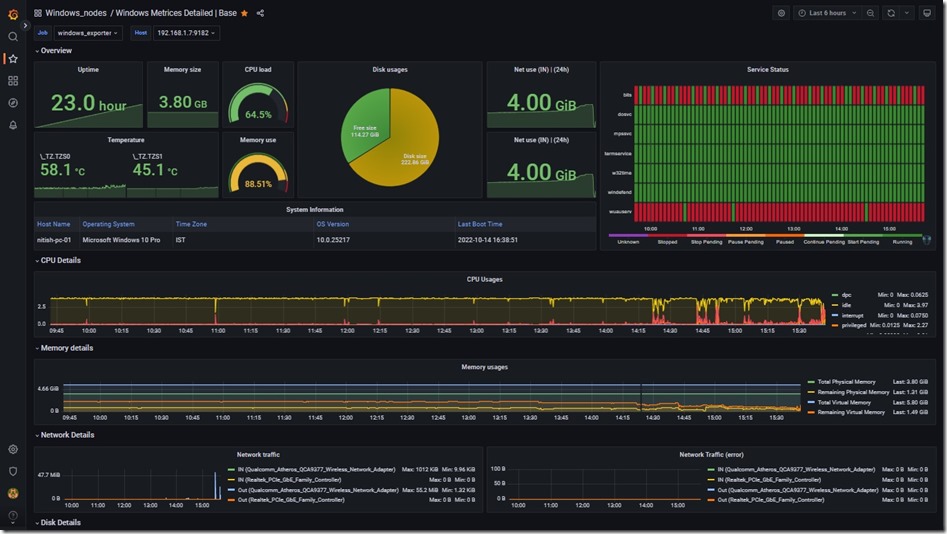
Windows Dashboard

Let’s go through introduction first, what is Prometheus? Some sci-fi movie title?

Prometheus is an open-source systems monitoring and alerting toolkit originally built at SoundCloud to meet requirements like a multi-dimensional data model, operational simplicity, scalable data collection, and a powerful query language, all in a single tool. The project was open-source from the beginning and began to be used by Boxever and Docker users as well, despite not being explicitly announced. Prometheus was inspired by the monitoring tool Borgmon used at Google. In May 2016, the Cloud Native Computing Foundation accepted Prometheus as its second incubated project, after Kubernetes. The blog post announcing this stated that the tool was in use at many companies including DigitalOcean, Ericsson, CoreOS, Weaveworks, Red Hat, and Google.

Second incubated project after Kubernetes? Impressive, no?

What about Grafana?

Grafana is a multi-platform open source analytics and interactive visualization web application. It provides charts, graphs, and alerts for the web when connected to supported data sources. A licensed Grafana Enterprise version with additional capabilities is also available as a self-hosted installation or an account on the Grafana Labs cloud service. It is expandable through a plug-in system. End users can create complex monitoring dashboards using interactive query builders. Grafana is divided into a front end and back end, written in TypeScript and Go, respectively.

As a visualization tool, Grafana is a popular component in monitoring stacks, often used in combination with time series databases such as InfluxDB, Prometheus and Graphite; monitoring platforms such as Sensu, Icinga, Checkmk, Zabbix, Netdata, and PRTG; SIEMs such as Elasticsearch and Splunk; and other data sources.

Ok enough of introduction, let’s begin with steps to setup one. Continue reading “Monitoring IT Infra with Prometheus and Grafana – Part 1”

PowerShell: SharePoint Mass Deletion Alert

When working with Infrastructure and services, you would come across situations, for which you know standard solutions but due to cost reasons, you chose manual workarounds. This post would fall among those situations.

Microsoft Sharepoint services came out as a great alternative for File shares to the companies during Covid 19. Not only many automation options via Power Automate (MS Flow earlier) but it came with built-in backup via versioning (life saver I tell you). For those who were not willing to work with Web-Only option, OneDrive was another built-in capability with Windows 10 itself and was able to imitate good old file share mapping to user machines.

But there was a catch with OneDrive…..

Being a new tool, understanding the backend technology was a learning curve and during the journey many business people ended up mass deleting the content from SharePoint site thinking that they are just removing the files from their own machines or stopping the sync only. If caught in time, then SharePoint Administrator would restore the content from First stage or second stage recycle bin (if retention policies not there) or even educate the user accordingly but if not noticed in time then it might become headache. To be fair, Microsoft has many services, which can detect such scenarios and even take actions automatically if capable (like Azure Sentinel, Cloud App security and Retention Policies) but most of them come with considerable cost.

So, the question is, can our good old friend PowerShell help us in detecting such situations at least in some way so that damage may be minimized? Why not?

Continue reading “PowerShell: SharePoint Mass Deletion Alert”

PowerShell: Successful MFA logins with Log Analytics

Despite of the intent, nowadays I don’t get enough time to get back to blogging. It’s not the case that content is not there but in a way, so many things happening that its hard to decide if anything that important to write about.

Came across a typical issue of getting O365 login reports using PowerShell than usual GUI way, which is not only painfully slow but doesn’t has option to filter out basis user names or target specific list of applications. To solve the issue, have created a small script which may help you on the particular issue if you have OMS subscription for log analytics

Continue reading “PowerShell: Successful MFA logins with Log Analytics”